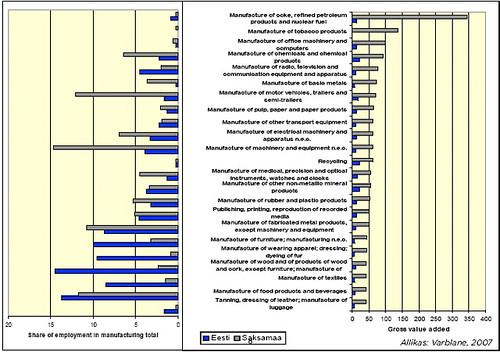
An interesting graph from a presentation by Ott Pärna, CEO of Estonian Development Fund (see also my post from their recent event, in Estonian). Estonian & German industries being compared here by employment (left) and value added per manufacturing area.
One common characteristic we share is that there are a lot of areas where a large share of people is adding a tiny part of the value for country’s economy. However, it is quite concerning how tilted towards the bottom (= less value) is the distribution of Estonian workforce.
It would be very interesting to see service industries in different countries being compared in a similar way – such as the software, biotech, nanotech and other innovation/R&D fields we talk so much about. Anyone have a good pointer?
PS: most value in German manufacturing is added with oil, nuclear fuel and tobacco? Scary…