Garage48.org guys had another one of their weekend hackathon events, returning to homely Estonia (after Helsinki and before Riga and Stockholm events – check them out) to focus more narrowly on building working apps that address some public service need.
There has been some fair coverage already, on the high quality output from the event (see the project list here) and some of the impediments the event revealed about things like government providing access to data freely for all kinds of app developers. (if you speak Estonian make sure to read Teller and Memokraat).
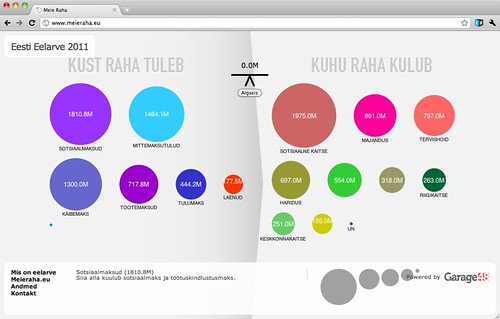
But more specifically I wanted to share a few thoughts on a special prize I got to hand out – for the state budget visualization app MeieRaha.eu (OurMoney in Estonian):
Why do I think it is important to visualize something seemingly as boring as a state budget?
First and foremost, it is definitely one set of data any country has to have that while touching every single person in a country is almost completely detached from any comprehension by those people. The reasons are multifold:
- access to data – frequently checking some spreadsheet files on Ministry of Finance webpages as a pasttime, anyone?
- volume of data – apparently the 2011 budget of relatively tiny Estonia is about 500 pages
- bureaucratic structure and terminology – regular people have mental models derived from their own life (kids/health/work…) rather than government structure or department responsibilities (different ministries, state vs municipal, etc)
- just too large numbers – a normal person can freely count money in the scale that they receive monthly on their own bank account, and maybe avoid major mistakes in the range of their annual income. (To argue for anything beyond look at consumer behavior before your average mortage crisis). For too many a million, 100 million or a billion blend together into abstract “a lot of money” that they are not able to grasp pragmatically, let alone have a comparative discussion around.
Understanding the dynamics of our budget, keeping it balanced, the relative scale and interconnections between income and expenditure items becomes double important before the elections (such as the ones we are in right now, to close this Sunday). Every party pays top dollar to put forward oversimplified promises in heavy pre-election advertising – but it is very hard for a voter to understand what the real cost (or alternative cost) of “free higher education for everyone”, “4-lane road from Tallinn to Riga”, “higher pensions for mothers” or rather silly “citizen salary for everyone” would be.
Taking the above thinking and some recent examples by New York Times Budget Puzzle or The Guardian’s Spending Review or Where Does My Money Go? (really, all worth checking out!), we were chatting with a few friends about a month ago on how to create something similar in Estonia before the March elections. As a citizen and technologist I am a huge supporter of anything that creates more transparency, better understanding, less populism and ultimately – more educated decisions in democracy. But as usual, everyone in that particular Skype chat though feeling very much the same played the always handy “I’m really busy this week” card and while at it I also added that if someone gets it done I’m happy to put some money in.
Though Garage48 events are never about the prospect of pay I was extremely glad that some people (namely Rene Lasseron, Tanel Kärp, Helena Rebane, Konstantin Tretjakov, Martin Grüner, Reigo Kinusar, Hegle Sarapuu, Henri Laupmaa – let me know if I’m missing someone!) came along with the idea and actually made it happen – and I got to keep my promise.
The site today works showing the actual approved 2011 budget for Republic of Estonia. You can fold items apart and together, resize the bubbles to see cross-dependencies, drag in comparison items (those gray bubbles on the bottom) and attempt to push the budget out of balance (the scales in the middle). Yes, there are a bunch of glitches here and there, but hey: what was the last piece of working software you delivered in a weekend?
On this baseline I hope at least part of the team will stick together and leverage some more organized support from research bodies like Praxis, one of the most prominent policy thinktanks around here (disclaimer: I happen to sit on the board there). There is a bunch of obvious improvements to prioritize and deliver now:
- translations to Russian, English and other languages
- automated and ordered data exchange with the government to manage updates (both budget changes inside a year as well as annual regular updates)
- improved engine for budget item interdependencies, to answer questions on what could happen if unemployment rates change and thus the actual tax collection goes up or down inside a year
- support for budget item “bundles”, for example to layer a number of budget item changes (like a certain party’s promises all together) on top of the baseline
- figure out the social possibilities on top of this data – how do people want to customize, record and share their versions of budget changes created by a tool
- tools for mainstream media to use this tool as a standard way to illustrate the impact of any ongoing public policy discussion
- … — please do leave more ideas in the comments!